

As COVID-19 continues to spread, the virulent disease has impacted our lives with restricted travel, cancelled public and sporting events, and it compels employees to work from home. Remote workers are not as well-protected as ones behind the defenses of the mothership. In times like these, it becomes even more important to protect your endpoints.
Endpoints: An Easy Target
In late 2018, the Ponemon Institute’s 2018 State of Endpoint Security Risk report stated that 34 percent of survey respondents indicated their endpoints had no protection. This figure represents an increase compared to the 2017 report’s 28 percent. Unsurprisingly, the majority—64 percent—of survey respondents indicated that their organizations were compromised by one or more endpoint attacks in 2018. Again, this number reflects an increase over the previous year (54 percent).
From Cyber Risk to Financial Risk
While the cyberrisk associated with endpoints is well-established, the financial risk—the minimum incurred yearly financial risk—is often considered in broad terms without sufficiently considering an organization’s characteristics.
Accurate determination of the minimum incurred yearly risk requires knowing multiple variables:
- The characteristics of an organization
- The probability an incident converting to data disclosure
- The impact per record disclosed
Probability of an Incident
Studies often site widely inaccurate claims around breach probabilities and their consequences. Lumping small and medium businesses (SMBs), enterprises and a broad range of industries into calculations results in inaccurate estimations that lack real-world context.
At eSentire, we created a risk propensity model based upon real-world observations. The figure below shows the probability of at least one security incident during a 12-month period.
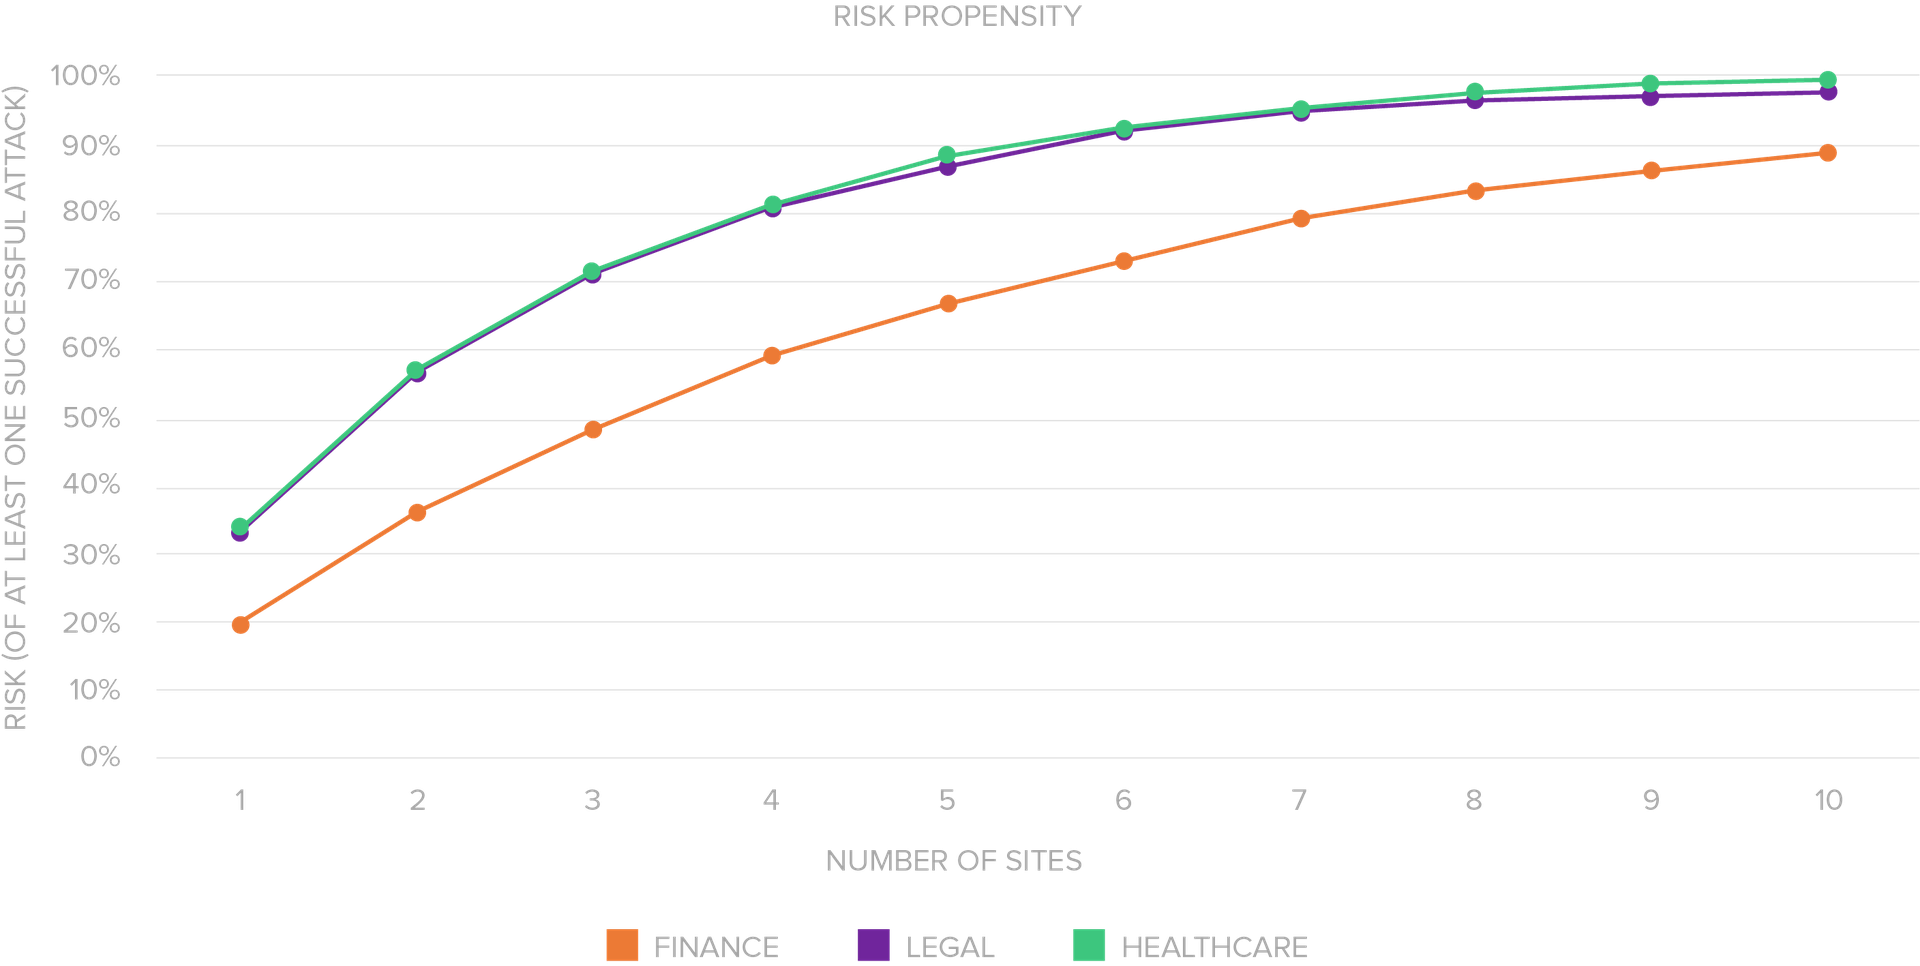
For illustrative purposes, we’ve shown three industries: finance, legal and healthcare.
The more sites an organization has, the higher the risk, due to the larger threat surface. To keep our model conservative, we assumed that each location is both independent and segregated from the others. That is, a breach at one site doesn’t make a breach at another any more likely, and a breach at one site does not spread laterally to another.
Conversion to Data Disclosure
While probability of an incident is important, conversion to data disclosure is critical for calculating risk. To continue with our illustrative purposes, finance, legal and healthcare organizations have observed incident conversion to data disclosure at rates of 22 percent, 23 percent and 65 percent.
Calculating the probability of an incident and it resulting in data disclosure requires multiplying our two variables: probability of an incident X conversion to data disclosure rate. For our finance, legal and healthcare illustrations we will use the values for organizations with three locations. The resultant probability of an incident converting to data disclosure is:
- Finance: 11 percent
- Legal: 17 percent
- Healthcare: 46 percent
Impact and Incurred Yearly Risk
Determining incurred yearly risk requires subjectivity from the organization at risk. To illustrate, the latest Ponemon Cost of a Data Breach Study reported that every record lost in a data breach results in the following cost:
- Finance: $210
- Legal: $178
- Healthcare: $429
No study can accurately project how many records an organization will lose if a data breach occurs. Leadership must determine, based on risk tolerance models, the projected number of records expected to lose in the case that a data breach occurs. For example, the below represents sample financial impact based on number of records lost:
| Records Lost | Finance | Legal | Healthcare |
| 1,000 | $210,000 | $178,000 | $429,000 |
| 25,000 | $5,250,000 | $4,450,000 | $10,725,000 |
| 50,000 | $10,500,000 | $8,900,000 | $21,450,000 |
While these values are representative of when data disclosure does occur, it lacks application of risk of an incident and conversion to data disclosure over a 12-month period. To ultimately arrive at minimum incurred yearly risk, we must combine impact with probability of incident to data disclosure. The resultant minimum incurred yearly risk is:
| Records Lost | Finance | Legal | Healthcare |
| 1,000 | $23,100 | $30,260 | $197,340 |
| 25,000 | $577,500 | $756,500 | $4,933,500 |
| 50,000 | $1,155,000 | $1,513,000 | $9,867,000 |
These values represent the minimum financial outlay organizations should expect over a 12-month period based on contextual risk.
If you want to better understand incurred yearly endpoint risk that your organization uniquely faces, download our Making the Case for Advanced Endpoint Protection white paper.

As eSentire's Director of Product Marketing, Wes oversees market intelligence, competitive research and go-to-market strategies. His multi-faceted, technology experience spans over a decade with market leaders such as Hewlett-Packard and Dell SecureWorks.